12 Questions Available
Showing 12 questions on this page
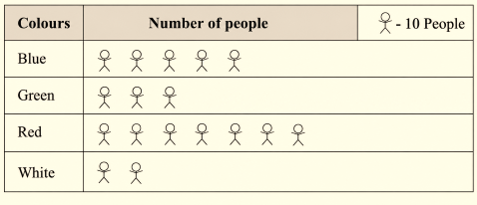
The colors of fridges preferred by people living in a locality are shown by the following pictograph Which colour most liked by the people?
In a village six fruit merchants sold the following number of fruit baskets in a particular season:
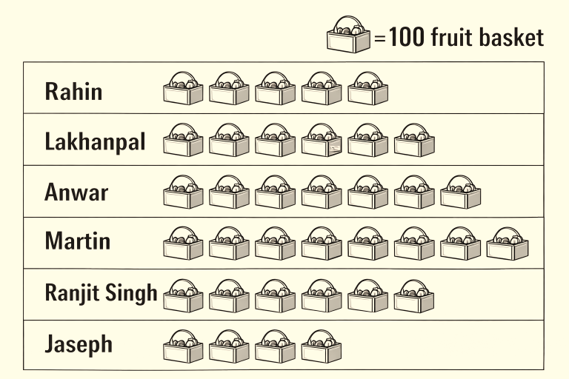
Observe this pictograph and answer the following questions:
(a) Which merchant sold the maximum number of baskets?
(b) How many fruit baskets were sold by Answer?
(c) The merchants who have sold 600 or more number of baskets are planning to buy a godown for the next season. Can you name them?
A survey of 120 school students was done to find which activity they prefer to do in their free time:
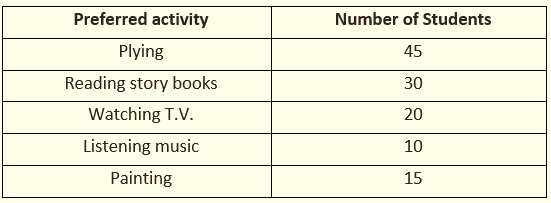
Draw a bar graph to illustrate the above data taking scale of 1 unit length = 5 students. Which activity is preferred by most of the students other than playing?
Mr. Rajan made a pictograph given below to show the number of cars washed at a car washing station during three days of a week.
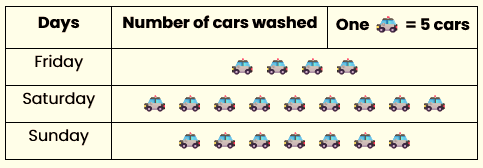
From the pictograph, find that:
(a) How many cars were washed on
(i) Friday
(ii) Saturday
(iii) Sunday?
(b) On which day the maximum number of cars were washed at the station?
(c) On which day the minimum number of cars were washed at the station?
(d) How many more cars were washed on Saturday than on Friday?
In March 2012, children for six colonies of Meerut were given pulse polio Drops. The colony wise number of children were as follows:
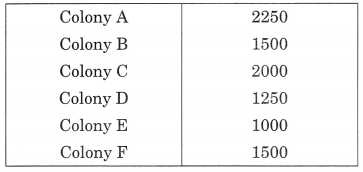
Represent the data by pictograph.
A die was thrown 35 times and the following numbers were obtained:
5, 1, 4, 2, 3, 2, 6, 6, 1, 4, 2, 5, 4, 5, 3, 6, 1, 5
2, 6, 2, 5, 4, 1, 3, 2, 1, 4, 1, 6, 2, 6, 3, 3, 3
Prepare a frequency table for the data.
The bar graph shows the number of toys produced by a factory during a certain week:
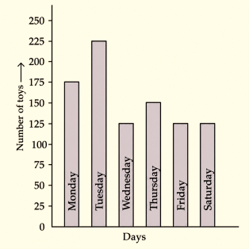
Answer the following questions:
(a) On which day the maximum number of toys were produced?
(b) On which day equal number of toys were produced?
(c) What is the total number of toys produced during the week?
(d) In which day minimum number of toys were produced?
The given bar graph represents the frequency of a, e, i, o, and u in a piece of English writing.
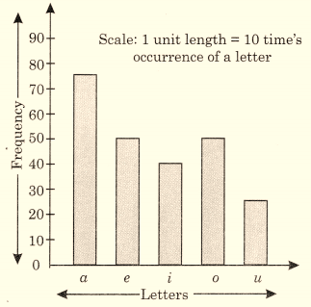
(a) Which letter occurred the maximum number of times?
(b) Which letter occurred 40 times?
(c) Which letter occurred less than 30 times?
(d) Write down the five letters in the decreasing order of frequencies.
Read the pictograph given below and answer the following questions:
Persons employed in one year
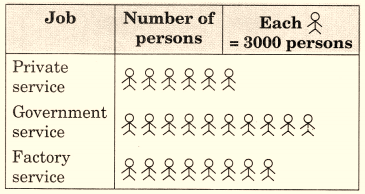
(a) What is the number of persons employed in government service?
(b) How many more person were employed in government service than in private service?
(c) In which service, were the maximum number of persons employed?
The result of a Mathematics test is as follows:
80, 90, 70, 80, 80, 60, 80, 70, 90, 65, 100, 60, 70, 60, 70, 85, 65, 70, 70, 85, 90, 60, 65, 80, 60
Make a frequency table for the above data and answer the following questions:
(a) What is the maximum marks obtained?
(b) How many students score less than 75 marks?
(c) How many students scored 80 marks or above?
(d) How many students appeared in the test?
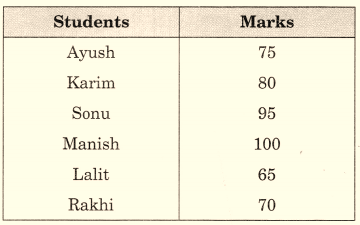
The marks obtained by six students in Mathematics are given below. Represent the. data by a bar graph. Use a scale of 0.5 cm for each name on the horizontal axis and 0.5 cm for 10 marks on the vertical axis.
For a math assignment a group of students had to draw their favorite shapes.
The following pictures represent their choices. Each picture stands for 25 shapes.