The result of a Mathematics test is as follows:
80, 90, 70, 80, 80, 60, 80, 70, 90, 65, 100, 60, 70, 60, 70, 85, 65, 70, 70, 85, 90, 60, 65, 80, 60
Make a frequency table for the above data and answer the following questions:
(a) What is the maximum marks obtained?
(b) How many students score less than 75 marks?
(c) How many students scored 80 marks or above?
(d) How many students appeared in the test?
From the above information, we have the following table.
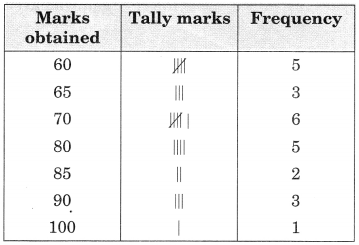
(a) Maximum marks obtained by a student = 100
(b) 5 + 3 + 6 = 14 students obtained marks less than 75.
(c) 5 + 2 + 3 + 1 = 11 students scored marks 80 or above 80.
(d) Total 25 students were appeared in the test.

