A survey of 120 school students was done to find which activity they prefer to do in their free time:
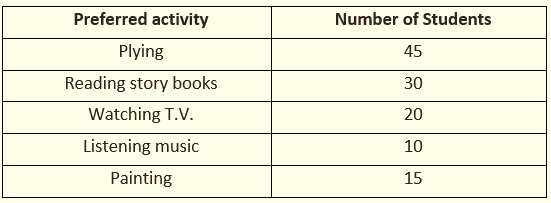
Draw a bar graph to illustrate the above data taking scale of 1 unit length = 5 students. Which activity is preferred by most of the students other than playing?
(1) Draw two perpendicular lines – one vertical and one horizontal.
(2) Along horizontal line mark the “Preferred activity” and along vertical line mark the “No. of students”.
(3) Take bars of same width keeping uniform gap between them.
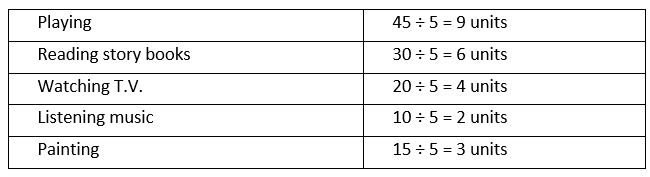
(4) Take scale of 1 unit length = 5 students along the vertical line and then mark the corresponding values.
(5) Calculate the heights of the bars for various activities preferred as shown below:
(6) Now draw various bars.
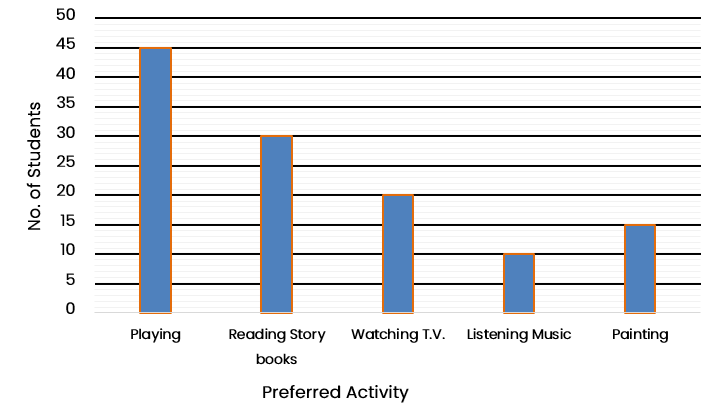
The activity “Reading story books” is preferred by most of the students other than playing.

