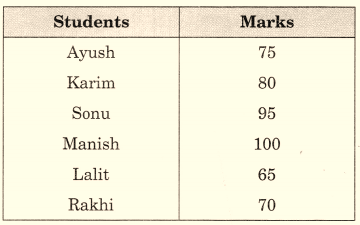
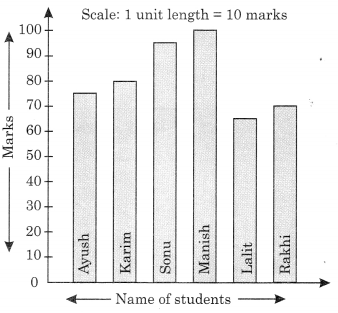
The marks obtained by six students in Mathematics are given below. Represent the. data by a bar graph. Use a scale of 0.5 cm for each name on the horizontal axis and 0.5 cm for 10 marks on the vertical axis.
Verified Answer
The required bar graph is given as below:
The marks obtained by six students in Mathematics are given below. Represent the. data by a bar graph. Use a scale of 0.5 cm for each name on the horizontal axis and 0.5 cm for 10 marks on the vertical axis. | Shiksha Nation