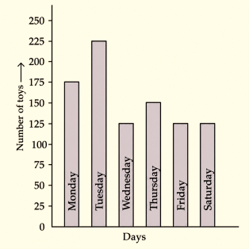
The bar graph shows the number of toys produced by a factory during a certain week:
Answer the following questions:
(a) On which day the maximum number of toys were produced?
(b) On which day equal number of toys were produced?
(c) What is the total number of toys produced during the week?
(d) In which day minimum number of toys were produced?
(a) The maximum number of toys were produced on Tuesday.
(b) Wednesday and Thursday, Friday and Saturday have equal number of toys were produced.
(c) Total number of toys produced in the week = 175 + 225 + 150 + 150 + 125 + 125 = 900
(d) Minimum number of toys were produced on Friday and Saturday.

