Solve the following system of Linear inequalities graphically.
x + y ≥ 5 … (1),
x + y ≤ –5… (2)
We first plot the equality of both equations (1) and (2)
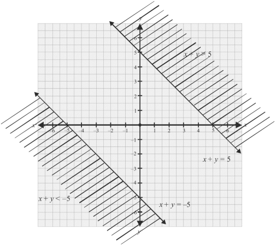
For equation x + y = 5
Putting x = 0, y = 5
A point on the line is (0, 5)
Putting y = 0, x = 5
Another point on the line is (5, 0)
For equation x + y = –5
Putting x = 0, y = –5
A point on the line is (0, –5)
Putting y = 0 x = –5
Another point on the line is (–5, 0)
For equation (1), i.e. x + y 5
Let us take any point say (0, 0), then inequality becomes
0 + 0 5 which is not true
Thus, we shade the region where (0, 0) does not lie. For equation (2), i.e. x + y ≤ –5
Let us take any point say (0, 0) then inequality becomes, 0 ≤ –5 which is not true.
Thus, we shade the region where point (0, 0) does not lie.
There is no common shaded region, i.e. no feasible region hence there is no common solution of given inequalities.

