Question
Class 7MathematicsData Handling Class 7
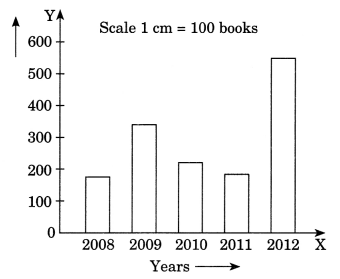
The following bar graph shows the number of books sold by a publisher during the five consecutive years. Read the bar graph and answer the following questions:
(i) About how many books were sold in 2008, 2009 and 2012 years?
(ii) In which years were 575 books were sold?
(iii) In which years were the minimum number of books sold?
Verified Answer
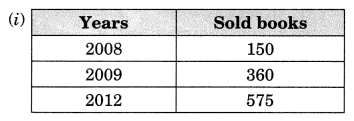
(ii) In the year of 2012, maximum number of books i.e. 575 were sold.
(iii) Minimum number of books i.e. 150 were sold in the year 2008.