The data given below shows the production of motorbikes in a factory for some months of two consecutive years.
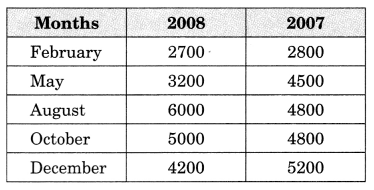
Study the table given above and the answer the following questions:
(a) Draw a double bar graph using an appropriate scale to depict the above information and compare them.
(b) In which year was the total output maximum?
(c) Find the mean production for the year 2007.
(d) For which month was the difference between the production for the two years is the maximum?
(e) In which month for the year 2008, the production was the maximum?
(f) In which month for the year 2007, the production was the least?
Verified Answer
(a) Double bar graph
Scale : 1 cm = 100 Motor Bikes
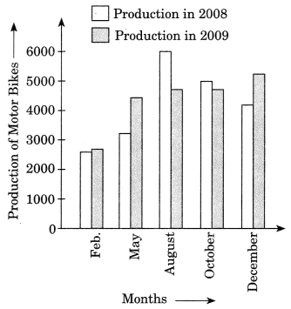
The above bar graph depicts the total production of motorbikes in two consecutive years.
Total production in 2007 was 22100 whereas in 2008 it was 21100.
(b) In the year 2007, the total production was maximum (22100)
(c) Mean production in the year 2007 is
= 2800+ 4500+ 4800 + 4800 + 5200 /5
= 22100/5 = 4420
(d) Production of motorbikes in the May 2007 = 4500 and in May 2008 = 3200
Difference = 4500 – 3200 = 1300 which is the maximum
(e) In the month of August 2008, production was maximum i.e., 6000
(f) In the month of Feb. 2007 the production was least i.e., 2800.