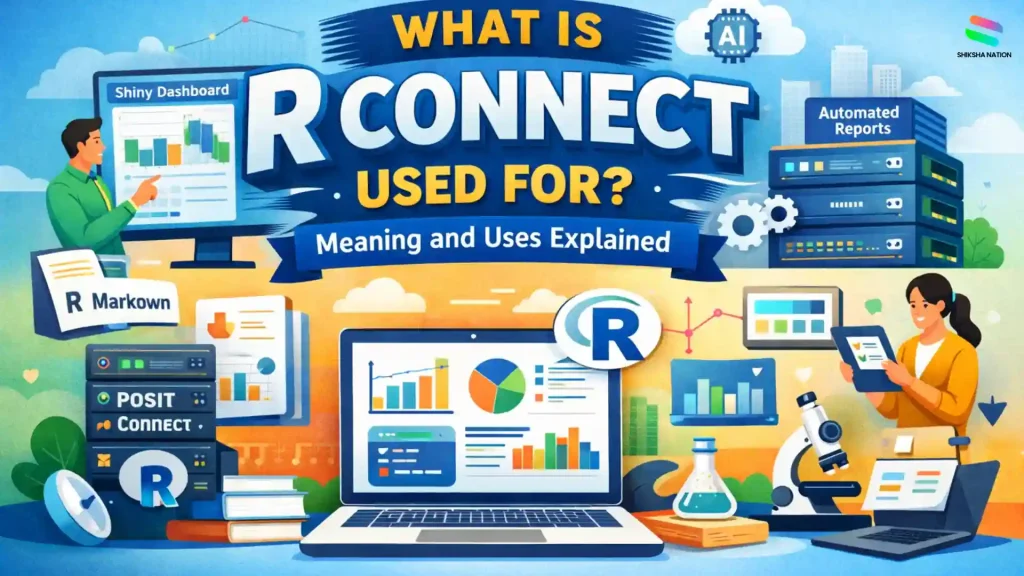
What Is R Connect? (Meaning Explained)
The term R Connect usually refers to a platform used to share and run data science work created using the R programming language. Many beginners search what is rconnect because the name appears in discussions about analytics tools and data science platforms.
In most professional environments, R Connect actually refers to RStudio Connect, now known as Posit Connect. This platform helps teams publish reports, dashboards, and applications built with R so that other people in the organisation can access them through a browser.
Understanding the r connect meaning becomes easier if you see it as a system that moves R projects from a developer’s computer to a shared platform where others can view and use them.
How R Connect Works in the R Ecosystem
| Tool |
Role |
| R Programming |
Used to write code and analyse data |
| RStudio |
Environment where developers create R projects |
| R Connect software |
Platform used to publish and share those projects |
For students learning data science or programming, this shows how real companies manage and share analytical work created using R.
What Is R Connect Used For in Data Science?
To understand what is R connect used for, it helps to look at how data science teams work in companies and research organisations. After analysing data in R, the results need to be shared with managers, teachers, or decision-makers.
R Connect acts as a data science deployment platform that allows teams to publish their analysis so others can access it easily through a web browser. Instead of sending files again and again, everything can be shared from one place.
Below are some common uses of R Connect in real data science environments.
Sharing Data Reports
Many analysts create detailed reports using R.
With R Connect, these reports can be published online so teams can view updated insights without downloading files.
Example uses:
- Business performance reports
- Education research reports
- Student data analysis dashboards in institutions
This makes it easier for teams to stay informed.
Deploying Interactive Dashboards
R Connect allows developers to publish dashboards where users can interact with data.
Examples include:
- Sales performance dashboards
- Website traffic analytics
- Student progress tracking tools
Such dashboards help organisations make faster decisions using real data.
Hosting Data Science Applications
R Connect also works as an enterprise data science platform where teams can deploy applications built with R.
Examples of apps:
- Data analysis tools
- Prediction models
- Research data visualisation apps
These tools can be used internally by different departments.
Running Automated Analytics
Another important use is automation. Reports and analysis can be scheduled to run automatically.
For example:
| Task |
Automated Update |
| Website analytics report |
Daily |
| Business performance report |
Weekly |
| Data monitoring report |
Monthly |
Because of this, R Connect becomes one of the useful data science collaboration tools used by modern analytics teams.
RStudio Connect (Posit Connect) Features
RStudio Connect, now known as Posit Connect, is designed to help organisations share and manage data science projects built with R. It provides a central platform where teams can publish reports, dashboards, and analytical tools.
Below are some important features that make this platform useful for data science teams.
Publishing Data Science Reports
One of the key features of RStudio Connect is the ability to publish R Markdown reports. These reports combine text, charts, and data analysis in one document.
For example, analysts can create reports such as:
- Monthly business performance reports
- Research analysis reports
- Data insights for management teams
Once published, the report can be accessed online without sharing files repeatedly.
RStudio Connect is developed by Posit (formerly RStudio), a company known for creating tools used widely in data science and analytics.
Deploying Interactive Dashboards
Another important capability is Shiny apps deployment. Shiny dashboards allow users to interact with data through filters, charts, and visual elements.
Common examples include:
- Sales performance dashboards
- Marketing analytics dashboards
- Education data tracking tools
These dashboards help teams understand data quickly.
Hosting APIs and Models
Posit Connect can also host APIs and machine learning models built using R. APIs allow different software systems to communicate with each other.
For example:
- A prediction model can provide results to a web application
- Analytics tools can connect with internal business systems
This helps integrate data science solutions into real business workflows.
Scheduling Automated Reports
Another useful feature is automation. Reports and dashboards can be scheduled to update automatically.
| Task |
Example Update Time |
| Sales report |
Daily |
| Data monitoring report |
Weekly |
| Performance analysis |
Monthly |
This automation helps organisations maintain regular analytics updates without manual effort.
How R Connect Fits in the R Programming Ecosystem
To understand its role, it helps to look at the R programming ecosystem. Different tools are used at different stages of data analysis. Some tools help write code, while others help share the results with teams.
R Connect works as a platform that publishes and manages projects created using R programming tools.
RStudio vs R Connect
| Tool |
Role in the Workflow |
| R Programming |
Used to analyse data and build models |
| RStudio |
Environment where developers write and test code |
| R Connect |
Platform used to publish and share the results |
In many organisations, analysts create projects in RStudio and then publish them through R Connect so others can view dashboards or reports online.
Because of this role, R Connect becomes an important part of the R analytics platform used in companies, research groups, and data-driven teams.
For students learning programming, understanding this workflow helps them see how data analysis moves from code to real-world applications.
Where Students May Encounter R Connect
Students may not use R Connect during school studies, but they often encounter it when learning data science and analytics tools in higher education or professional courses.
Many organisations use R-based systems to analyse large datasets and share insights.
Common Fields Where R Connect Is Used
- Data science teams analysing business or research data
- Business analytics departments tracking company performance
- AI and machine learning teams deploying predictive models
- Research labs and universities publishing analytical reports
These environments rely on platforms that support R programming applications and help teams collaborate.
For beginners exploring how R is used in data science, tools like R Connect are part of the broader ecosystem of data science tools for beginners that support real-world analytics projects.
Difference Between RStudio and RStudio Connect
Many beginners get confused between RStudio and RStudio Connect. Both belong to the same ecosystem but serve different purposes.
RStudio is mainly used to write and test code, while RStudio Connect helps publish and manage the work created in R.
Comparison between RStudio and RStudio Connect
| Tool |
Purpose |
| RStudio |
Development environment used to write and run R code |
| RStudio Connect |
Deployment platform used to publish reports, dashboards, and applications |
In simple terms, RStudio is where the work is created, while RStudio Connect works as the r connect software that shares the final output with teams.
Because of this role, it is often described as an r connect tool that helps organisations distribute analytics results easily.
Conclusion
R Connect plays an important role in modern data science workflows. It acts as a platform that allows teams to publish and share reports, dashboards, and analytics tools created using the R language.
Understanding what is R connect used for becomes easier when you see it as a bridge between coding and real-world use. Data scientists build their analysis using R programming tools, and platforms like R Connect help deliver those insights to teams, organisations, and researchers.
For students interested in analytics or data science careers, learning about these tools provides a clearer picture of how data-driven work is managed in professional environments.
FAQs About R Connect
Q. Is R Connect the same as RStudio Connect?
Yes, in most cases when people ask what is rconnect, they are referring to RStudio Connect, which is now called Posit Connect. The platform was originally developed by RStudio, and later the company changed its name to Posit. The purpose of the platform remained the same. It helps organisations publish reports, dashboards, and applications created using the R programming language. So, while the name may appear different, RStudio Connect and Posit Connect usually describe the same platform used in data science environments.
Q. What is Posit Connect used for?
Posit Connect is used to share data science work with teams in a simple and organised way. Data scientists often create dashboards, reports, or analytical tools using R. Posit Connect allows them to publish these projects so others can access them through a web browser. In companies and research institutions, this platform helps teams view updated data insights without needing to run the code themselves.
Q. Do beginners need to learn R Connect?
Beginners who are just starting with R programming usually focus first on learning the basics of coding and data analysis. Tools like RStudio are more important at the early stage. The r connect tool becomes relevant later when students work on real-world projects or team-based analytics. It is mostly used by professionals who need to share their analysis with others.
Q. R Connect used in data science jobs?
Yes, R Connect can be used in many data science roles. Companies that rely on R for analytics often use platforms like RStudio Connect to publish dashboards and reports. It helps teams access insights without running complex code. For students planning careers in analytics, understanding such platforms can give a better idea of how data science work is managed in organisations.
Q. What tools are commonly used with R programming?
Several tools are commonly used along with R programming. These include development environments, reporting tools, and deployment platforms.
Examples include:
- RStudio – used for writing and testing R code
- R Markdown – used to create analytical reports
- Shiny – used to build interactive dashboards
- RStudio Connect – used to publish and share projects
These tools together form part of the data science tools for beginners who want to explore analytics using R.
Q. Is R Connect free to use?
RStudio Connect (Posit Connect) is generally a commercial platform used by organisations. Companies purchase licences to deploy it on their internal servers. Individual learners usually do not need it while studying basic R programming. Students normally interact with it only when working in companies or research teams that use enterprise analytics systems.
Q. Can R Connect run automatically scheduled reports?
Yes, one useful feature of R Connect is automation. Teams can schedule reports and dashboards to update automatically at fixed intervals. For example, a company may generate weekly performance reports or daily data updates. This reduces manual work and ensures that teams always see the latest insights.
Q. Is R Connect only used with the R programming language?
R Connect mainly supports projects built with the R programming language. However, it can also integrate with other data science tools and workflows in modern analytics environments. Its main goal is to help teams share and manage analytical work created using R-based applications.